In audio software, performance is sink or swim. Every five or so milliseconds, the operating system hands you a buffer of audio samples, and you must process those samples and return from the render callback before time runs out. Otherwise, the audio card will be forced to emit zeros to the audio output, the user will hear a pop, and they will uninstall your product.
It should come as no surprise that, at iZotope, we obsess over the execution speed of our DSP.
In our Spire Studio product, the situation is even more dire. Whereas our desktop products run on beefy Intel processors designed for speed, Spire Studio (hereon: “Spire”) sports a smaller ARM core, which gets the job done but has tight constraints. Given this, we watch our CPU budget like a hawk.
This is the story of a hunt, about what happens when you let that budget escape your gaze.
pop

One day during a routine test, one of our QA engineers saw Spire’s CPU redline while previewing our Enhance feature. top showed the CPU usage hitting 99%, when normally it’s around 70%. This was a huge performance regression and made the product unusable while in that mode.
Needless to say, when that Slack notification crossed my screen, my heart rate shot up.
Wasting no time, I grabbed both “good” and “bad” versions of our code and inspected the diff looking for suspicious changes. Most of the time, these kinds of regressions come from updates to our DSP algorithms that don’t play well with Spire. No such luck this time, though–the diff was innocuous.
When you’ve got no idea why a Linux binary has gotten slower, perf is your friend. I loaded up a debug build, ran perf record on both versions, then dumped the output into flamegraphs.
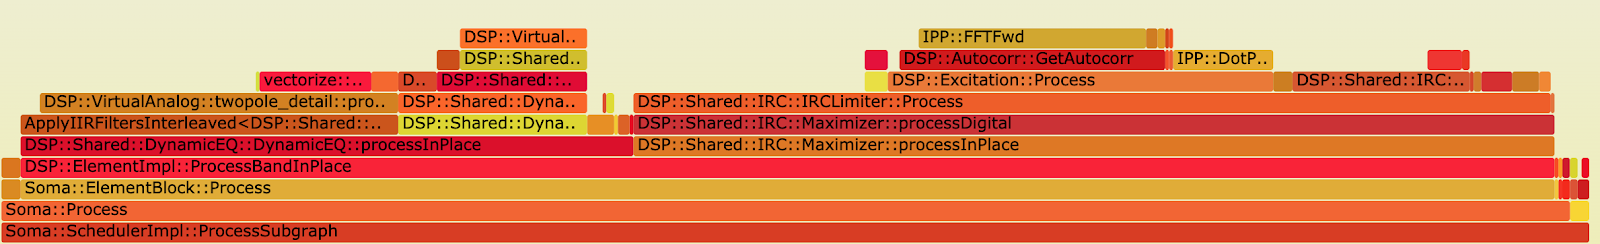
The images below show the amount of time our process spent in various functions in our code, made possible through the magic of sampling-based profiling:
“Good” flamegraph:
“Bad” flamegraph:
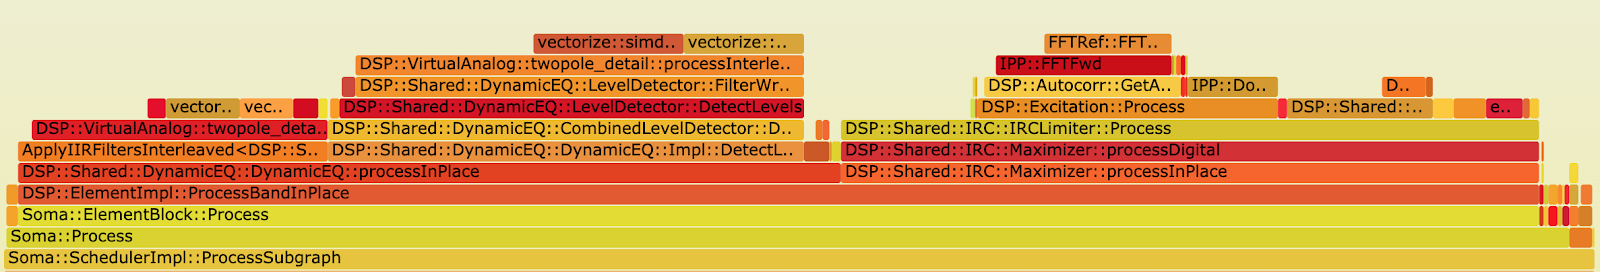
Lucky for me, the regression was obvious: DynamicEQ::processInPlace takes a much larger percentage of time in the “bad” flamegraph than in the “good” one. In particular, LevelDetector::FilterWrapper::Process had regressed.
This was a good start, but before going down a rabbit hole I decided to do a sanity check by comparing the microbenchmarks for LevelDetector. I fired up our Google benchmark suite, and sure enough, the benchmarks ran 4x slower on the bad build than on the good build. I breathed a sigh of relief–LevelDetector was the culprit.
Having already disqualified an algorithm change through code inspection, I looked at the compilation options. Changing compiler flags can have drastic effects on performance. Unfortunately, there were no changes except for include paths, which shouldn’t affect code generation.
At this point, I was a bit lost. There were no significant changes to the source code, and no changes to the compiler. What could possibly be the problem?
After taking a moment to reflect in disillusionment, I brought back the diff.
The only dependency that changed in a meaningful way was iZBase, the C++ library all our code depends on. The change added #include <boost/expected.hpp> to our pre-compiled header. But surely that change had nothing to do with this performance regression, because the dynamic EQ didn’t even use expected. Just adding an include to LevelDetector.cpp shouldn’t have done any harm.
…Right?
It was time to ignore my intuition and see if this expected.hpp include could actually make any difference in performance. In the “bad” code, I removed expected.hpp from the precompiled header, making no other changes, and created a new build.
CPU: 70%.
Oh.
So why would adding a header cause a performance regression? It was time to dive into the deep end and inspect the object code.
gdb -q /path/to/LevelDetector.o
info functions
A clue: there were a different number of functions defined between the two object files. Notably, the “bad” build had boost::expected member functions defined. This made sense, because expected is a header-only library, and so its definitions end up in every object file that uses it. Interesting observation, but what changed in the DSP functions themselves?
In the flamegraphs, the lowest level of the call stack with the performance gap was a function called
DSP::VirtualAnalog::twopole_detail::processInterleavedOptimizedForChannelCount<1, float const, float, double, double, DSP::VirtualAnalog::BandpassCalculator>I ran the process, fired up remote gdb and examined the codegen for this function:
disassemble DSP::VirtualAnalog::twopole_detail::processInterleavedOptimizedForChannelCount<1, float const, float, double, double, DSP::VirtualAnalog::BandpassCalculator>I skimmed through the mostly-unintelligible output, squinting my eyes for something resembling a problem. And there it was:
bl 0x4130ac <vectorize::simd::operator*(vectorize::simd::pack<double, 2u>, vectorize::simd::pack<double, 2u>)>bl is a branch instruction, which means it’s calling a function. See the ARM documentation. In particular, the “bad” code was calling simd::operator* on every iteration of the inner loop.
This function is part of vectorize, a SIMD-abstraction library made by one of our old employees. simd::operator* is a hyper-optimized multiplication function used when we need to squeeze every bit of performance out of a loop, which means we nearly always want to inline it. And sure enough, the “good” code’s disassembly showed these calls were inlined:
vmul.f64	d31, d31, d2
vmul.f64	d19, d19, d2
vmul.f64	d10, d10, d2
vmul.f64	d31, d31, d2
Apparently, GCC’s inliner had betrayed us, adding tens of function calls to the hottest code in LevelDetector. Smoking gun!
But what did adding the expected.hpp include have to do with inlining?
Compilers choose whether or not to inline a function based on many heuristics, but an important one is code size. If the compiler decides inlining a function will make the object file or calling function too much larger, it will not inline the function. When we added expected.hpp to the pre-compiled header, we added some function definitions to the object file, which tripled the code size from 21K to 67K. This was enough to convince GCC to not inline simd::operator*.
To put a bow on the investigation, I added __attribute(always_inline)__ to all the simd operators, and sure enough, our code was fast again, even with the expected.hpp include.
What did we learn from all this?
First of all, don’t always trust your instincts, because there are holes in your wisdom. I knew about the expected.hpp include early on, but went down a few unrelated rabbit holes–some of which I didn’t even mention in this article–because I didn’t believe this could cause a performance regression. Trust the data over your gut!
Second, inlining is crucial for CPU-bound tasks. It’s not always enough to use the inline C++ keyword, because it’s just a hint. Sometimes you know better than the compiler how important it is to inline something.
Finally, this re-enforces how valuable it is to have a close team that keeps an eye on quality. By working together, our team is able to find and resolve issues like this quickly, leaving time to toast our accomplishments at beer o’clock.
John Pothier, Engineer for iZotope Spire
